(oh and deathnote, you totally took t-lympho's first art entry!)
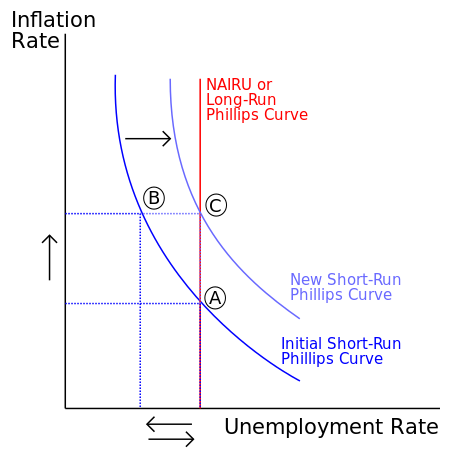
 this is the phillip's curve, created by A.W. Phillips during the 1960s.
what?
- curve created from data gathered on the relationship between inflation and unemployment in UK between 1861 and 1967.
- curve shows an INVERSE relation between inflation and unemployment, i.e. as unemployment decreases, inflation increases (higher wages for all!).
but...
- governments understood the curve as there being a trade off between unemployment and inflation
so?
- governments allowed inflation rates to increase, hoping that unemployment rates would then decrease.
HOWEVER!
- the philips curve broke down.
- 1970s: many countries experienced increased inflation together with increased unemployment instead.
questions/usage
- correlation =/= cause (if two variables are correlated, it does not mean that they cause each other, i.e. fallacy of post hoc ergo propter hoc)
- in this phillips curve case, there could be 3 types of explanations for the correlation -
- 1. A cause B
- 2. B cause A
- 3. C cause A & B.
- definitely for use in social science.
sources
- wiki: phillips curve
- theory of knowledge by Richard van de Lagemaat
\ \ / / bam.


